You suspect your SSD is wearing out—what “life left” actually means in practice
Most people notice it the same way: Windows takes longer to boot, apps hang on “Not Responding,” or a file copy that used to finish in seconds crawls. It’s easy to assume the SSD is “dying,” but “life left” usually doesn’t mean time—it means how much writing the drive’s flash has already absorbed compared to what it was built to handle.
That’s why the scary part is also the confusing part: a drive can feel slow because of heat, a near-full disk, or a bad cable, while its wear level is still fine. At the same time, a drive can look “healthy” and still log early warning signs like rising errors or a shrinking wear indicator. The goal here is to separate wear from noise, fast.
We’ll start with the quickest Windows check that flags obvious trouble before you dig into any numbers.
Way #1: The 2‑minute Windows check that catches obvious trouble first
That quickest Windows check is whether the drive is already reporting a plain-English problem. Open the Start menu, type cmd, right-click Command Prompt, and choose Run as administrator. Then run: wmic diskdrive get model,status. If you see OK, Windows isn’t seeing a basic SMART failure. If you see Pred Fail (or anything other than OK), stop arguing with symptoms: back up immediately and plan a replacement.
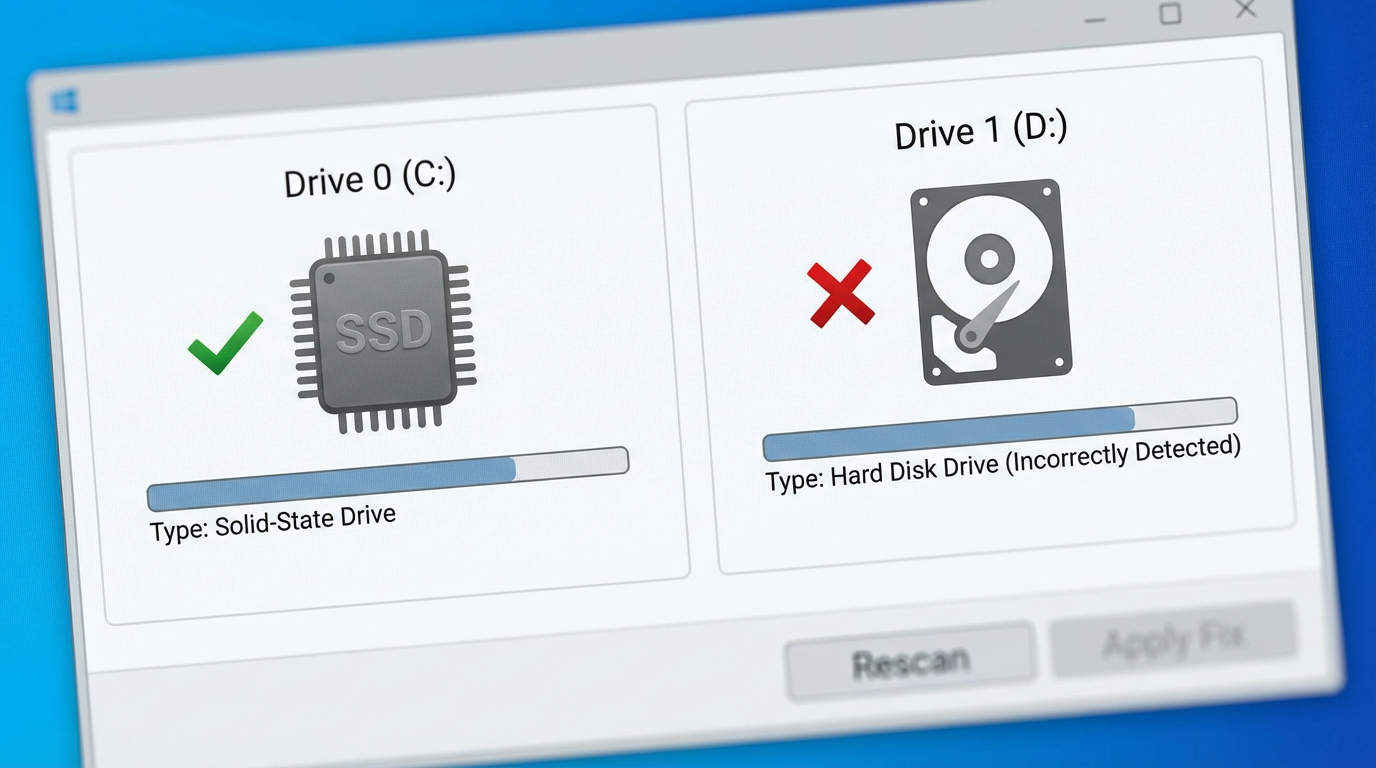
Also take 20 seconds to check what Windows is optimizing. Search Defragment and Optimize Drives; your SSD should show Solid state drive, not a hard disk. If it’s mislabeled, you can end up with the wrong maintenance behavior. The trade-off here is that “OK” doesn’t mean “not wearing out”—it just means nothing obvious is tripping alarms, so it’s time to read the SMART values that actually matter.
Way #2: Reading SMART health without getting spooked by normal values
That’s where people get stuck: they open a SMART tool, see a wall of attributes, and assume any non-zero number means the SSD is failing. Most of those fields are counters, not a diagnosis. A “Reallocated Sector Count” of 0 is ideal, but values like “Power-On Hours,” “Power Cycle Count,” and even some “Unsafe Shutdown” counts can be completely normal on a laptop that sleeps, travels, and occasionally runs out of battery.
Focus on two buckets. Bucket one is clear red flags: a SMART overall status of “Bad,” any attribute the tool marks in red, or a trend where “Media and Data Integrity Errors”/“Uncorrectable Errors” keeps climbing week to week. Bucket two is wear-and-tear: “Percent Used,” “Wear Leveling Count,” or “Available Spare” (more on those next). The friction is that different brands rename the same idea, so don’t panic over labels—look for rising errors versus stable counters.
Way #3: Find your SSD’s wear indicator (the one that usually maps to lifespan)
Once you’ve stopped treating every non-zero SMART field like a crisis, the next move is to find the one value that actually answers “how worn is this SSD?” In many tools it’s called Percent Used (NVMe) or Wear Leveling Count/Media Wearout Indicator (common on SATA). These are the closest thing to a lifespan gauge: they rise as the drive consumes its planned write endurance.
What you want is a number you can watch over time. For example, Percent Used at 3% usually means “barely touched,” while 60% means you’re well into the back half. If the tool shows Health as a percent, treat it carefully—some vendors flip the meaning (100% = new, others show “used”).
The trade-off is that this wear indicator can look fine even when errors are starting to climb, so you still need both: stable errors and a wear number that isn’t racing upward. To sanity-check that wear number, convert your write totals into the drive’s TBW rating next.
Way #4: Convert “Total Host Writes” into a reality check against the drive’s TBW rating
That sanity-check usually comes down to one number your SSD has been quietly counting the whole time: Total Host Writes (sometimes “Host Writes” or “Data Written”). It’s how much data your PC has sent to the drive. If your wear indicator says you’re fine but host writes are already huge, you’ve found a mismatch worth digging into.
Grab the total writes from your SMART tool (CrystalDiskInfo, smartctl, your NVMe viewer—any is fine) and note the unit. Many NVMe drives report in TB or GB; some report in 512e sectors or “data units written,” which the tool usually converts. Then look up your model’s TBW (terabytes written) rating. If you’ve written 80TB on a 300TBW drive, you’re around 27% of the rated endurance. If you’re near 100%, tighten backups now and start shopping—because the consequence is you may be right at the point where small issues turn into real errors.
The friction: TBW is a rating, not a promise, and heavy writes can come from “background” habits like browser caches, big game updates, or VM work. If the math and your wear indicator disagree by a lot, the next step is using the maker’s dashboard and self-tests to settle it.
Way #5: Use the SSD maker’s dashboard and self-tests when numbers don’t agree
That disagreement is when you stop guessing and let the drive speak in its own language. Install the SSD maker’s tool (Samsung Magician, Crucial Storage Executive, WD Dashboard, Kingston SSD Manager, Intel MAS, etc.) and confirm it’s actually reading the right device and firmware. These dashboards often translate vendor-specific SMART fields into a single wear value, show “available spare,” and flag problems generic tools gloss over.
Run the built-in self-test if it’s offered. On many drives you’ll see a short test (minutes) and an extended test (longer, more thorough). The practical friction: extended tests can slow the system and they’re a bad idea right before a meeting or while you’re mid-download—schedule them. If the dashboard reports failing health, shrinking spare, or uncorrectable errors, treat that as your tie-breaker and tighten backups immediately.
If the dashboard looks clean but your SMART tool shows rising errors, prioritize data safety over debate. The next step is a quick decision pass: back up now, replace soon, or keep monitoring.
When to tighten backups now vs schedule a replacement soon (a quick decision pass)
That “keep monitoring vs act” moment usually hits when everything looks mostly fine, but one number nags at you. Use a simple pass: if you see Pred Fail, a dashboard warning, or uncorrectable/media integrity errors that keep rising, treat it like an active problem. Back up immediately (ideally to an external drive plus cloud) and schedule a replacement now, not “when it gets worse.”
If errors are stable at zero (or not increasing), decide based on wear and writes. If your wear indicator is 70–90% used or your host writes are near the TBW rating, tighten backups and start shopping so you can replace on your timeline. The trade-off is cost versus downtime: waiting can save money today, but it can also force an emergency reinstall at the worst time.
If you’re under ~50% used, well below TBW, and tests pass, keep using it and set a reminder to recheck monthly. That habit is what makes the next section easy.
Leave with a simple monitoring habit (so you’re not guessing next month)
That reminder matters because SSD wear is rarely a surprise when you track it the same way every month. Pick one day (like the first Monday) and record three items: your wear indicator (Percent Used / Media Wearout), Total Host Writes, and whether uncorrectable or media/data integrity errors changed. A simple note in Notepad or a spreadsheet works.
Keep the friction in mind: different tools can label the same thing differently, so stick to one SMART tool plus the maker’s dashboard as your tie-breaker. If wear jumps fast, errors start rising, or you cross ~80–90% used or near TBW, tighten backups and put a replacement on the calendar.